


| EVBettor Perfomance | |||||
| Week | Wins | Loss | Push | ATS | Performance |
| 1 | 6 | 3 | 0 | 67% | 2.7% |
| 2 | 8 | 7 | 0 | 53% | (2.2%) |
| 3 | 12 | 4 | 0 | 75% | 6.1% |
| 4 | 7 | 11 | 0 | 39% | (3.6%) |
| 5 | 6 | 9 | 0 | 40% | (3.2%) |
| 2017 Season | 39 | 34 | 0 | 53% | (0.2%) |
| 2016 Season | 164 | 121 | 4 | 58% | 41.3% |
Market Notes
Stylistically, success rate is to the NFL as batting average is to the MLB. Although, in practice, success rate operates more like FIP, a stat that is useful in isolating signal from noise. Just as infield hits are tougher to predict, in football, turnovers (fumbles, and to a lesser extent interceptions) are largely filled with randomness, as are big plays or short fields acquired from defense or special teams. Success rate is a stat that simply counts those plays as successful or not (Whether a 70-yard TD or a 1-yard first down). This helps to isolate which teams have over or underperformed their execution ability. Looking at a 4,500+ game sample, if you simply pick the team that wins the success rate battle you would be 59.8% ATS.
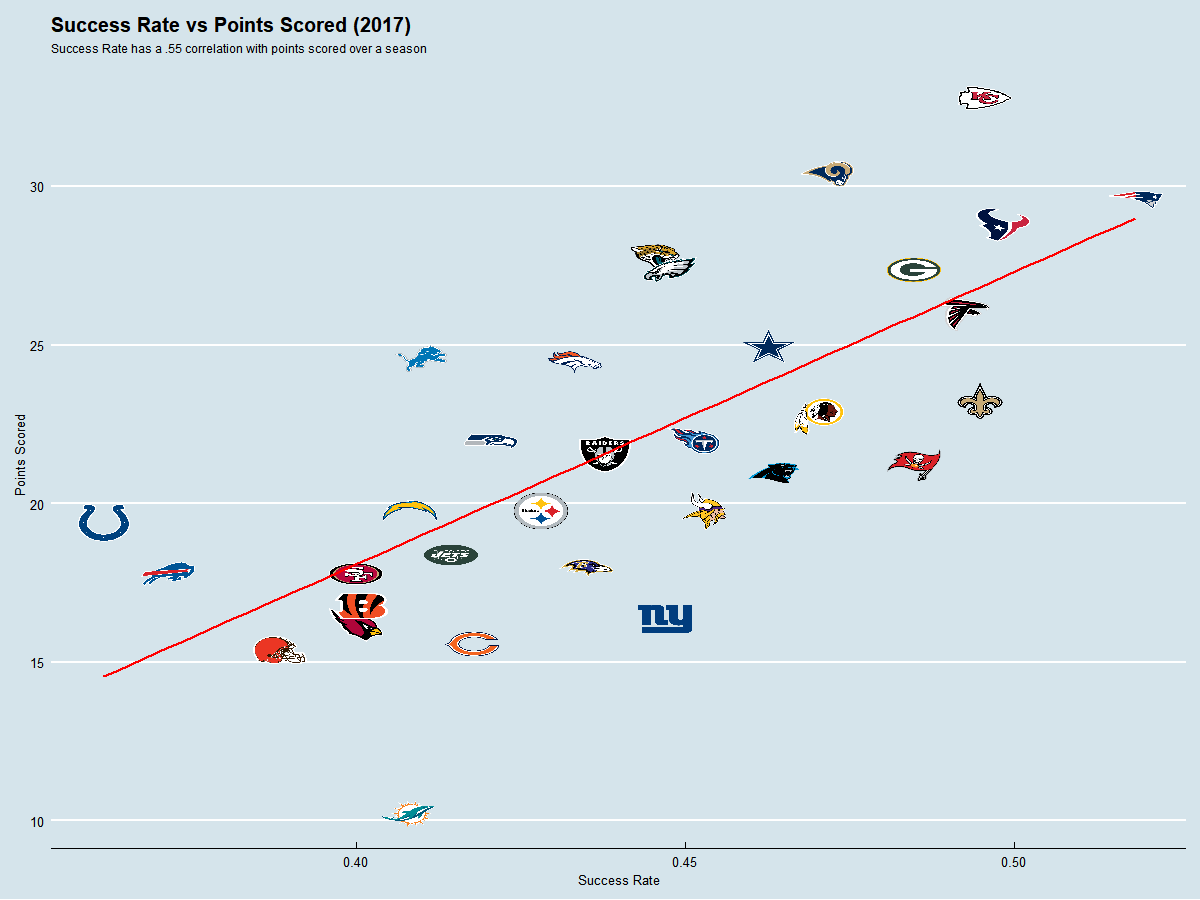
Below is a chart of average points scored vs a team’s success rate through week 5 this year. Team’s above the red line have overperformed their offensive success rate, while teams below have underperformed, for whatever reasons. Investigate the outliers to see if it is warranted or not. On the positive variance side you have KC, lucky or good? Miami, terrible or unlucky? Let me know your thoughts.
Thursday Plays (NOT Investment Advice) :
Sides
Big
- Carolina (-3)
Totals
Big
- PHI / CAR UNDER (46)