


“Bad beats” are those gut-punch (betting) losses, where the game seems to be all wrapped up…then a garbage touchdown, missed chip shot, dumb coaching or some other low-probability event (or combination of events) causes victory to flee from a once seemingly crocodile-like grip.
To anyone wagering long enough, you will have your stories, as they ALWAYS happen more than any bettor would like. But do they actually happen at a higher rate to more profitable bettors? While there is a finite number of bad beats possible, a profitable bettor’s losses will contain a higher proportion of “bad beats”.
Take a coin-flip bettor (random, 50% bettor), that person’s bet history would mimic the distribution of actual game outcomes. Where they would have some wins and some losses, as the picks would be a random sample of the actual game results. The ATS margin would be how far from the spread the actual game result was (Game Result – Spread = ATS Margin). If the Chiefs were favored to win by 7 and they actually won by 9, their ATS Margin for that game would be +2 (ATS win).
Below is an illustration of how the random bettor’s ATS wins distribution would appear over a long enough timeframe. There would be a certain proportion of games decided by a few points, where one-more garbage TD could be the difference between a blowout and a backdoor (the grey region), these are games that could fall into the “bad beat” category. This is the unavoidable uncertainty within every NFL season and could be the difference in the punter’s profitability of bad-to-good or good-to-great.
This distribution follows what the actual distribution of game outcomes look like (Illustrative Purposes):
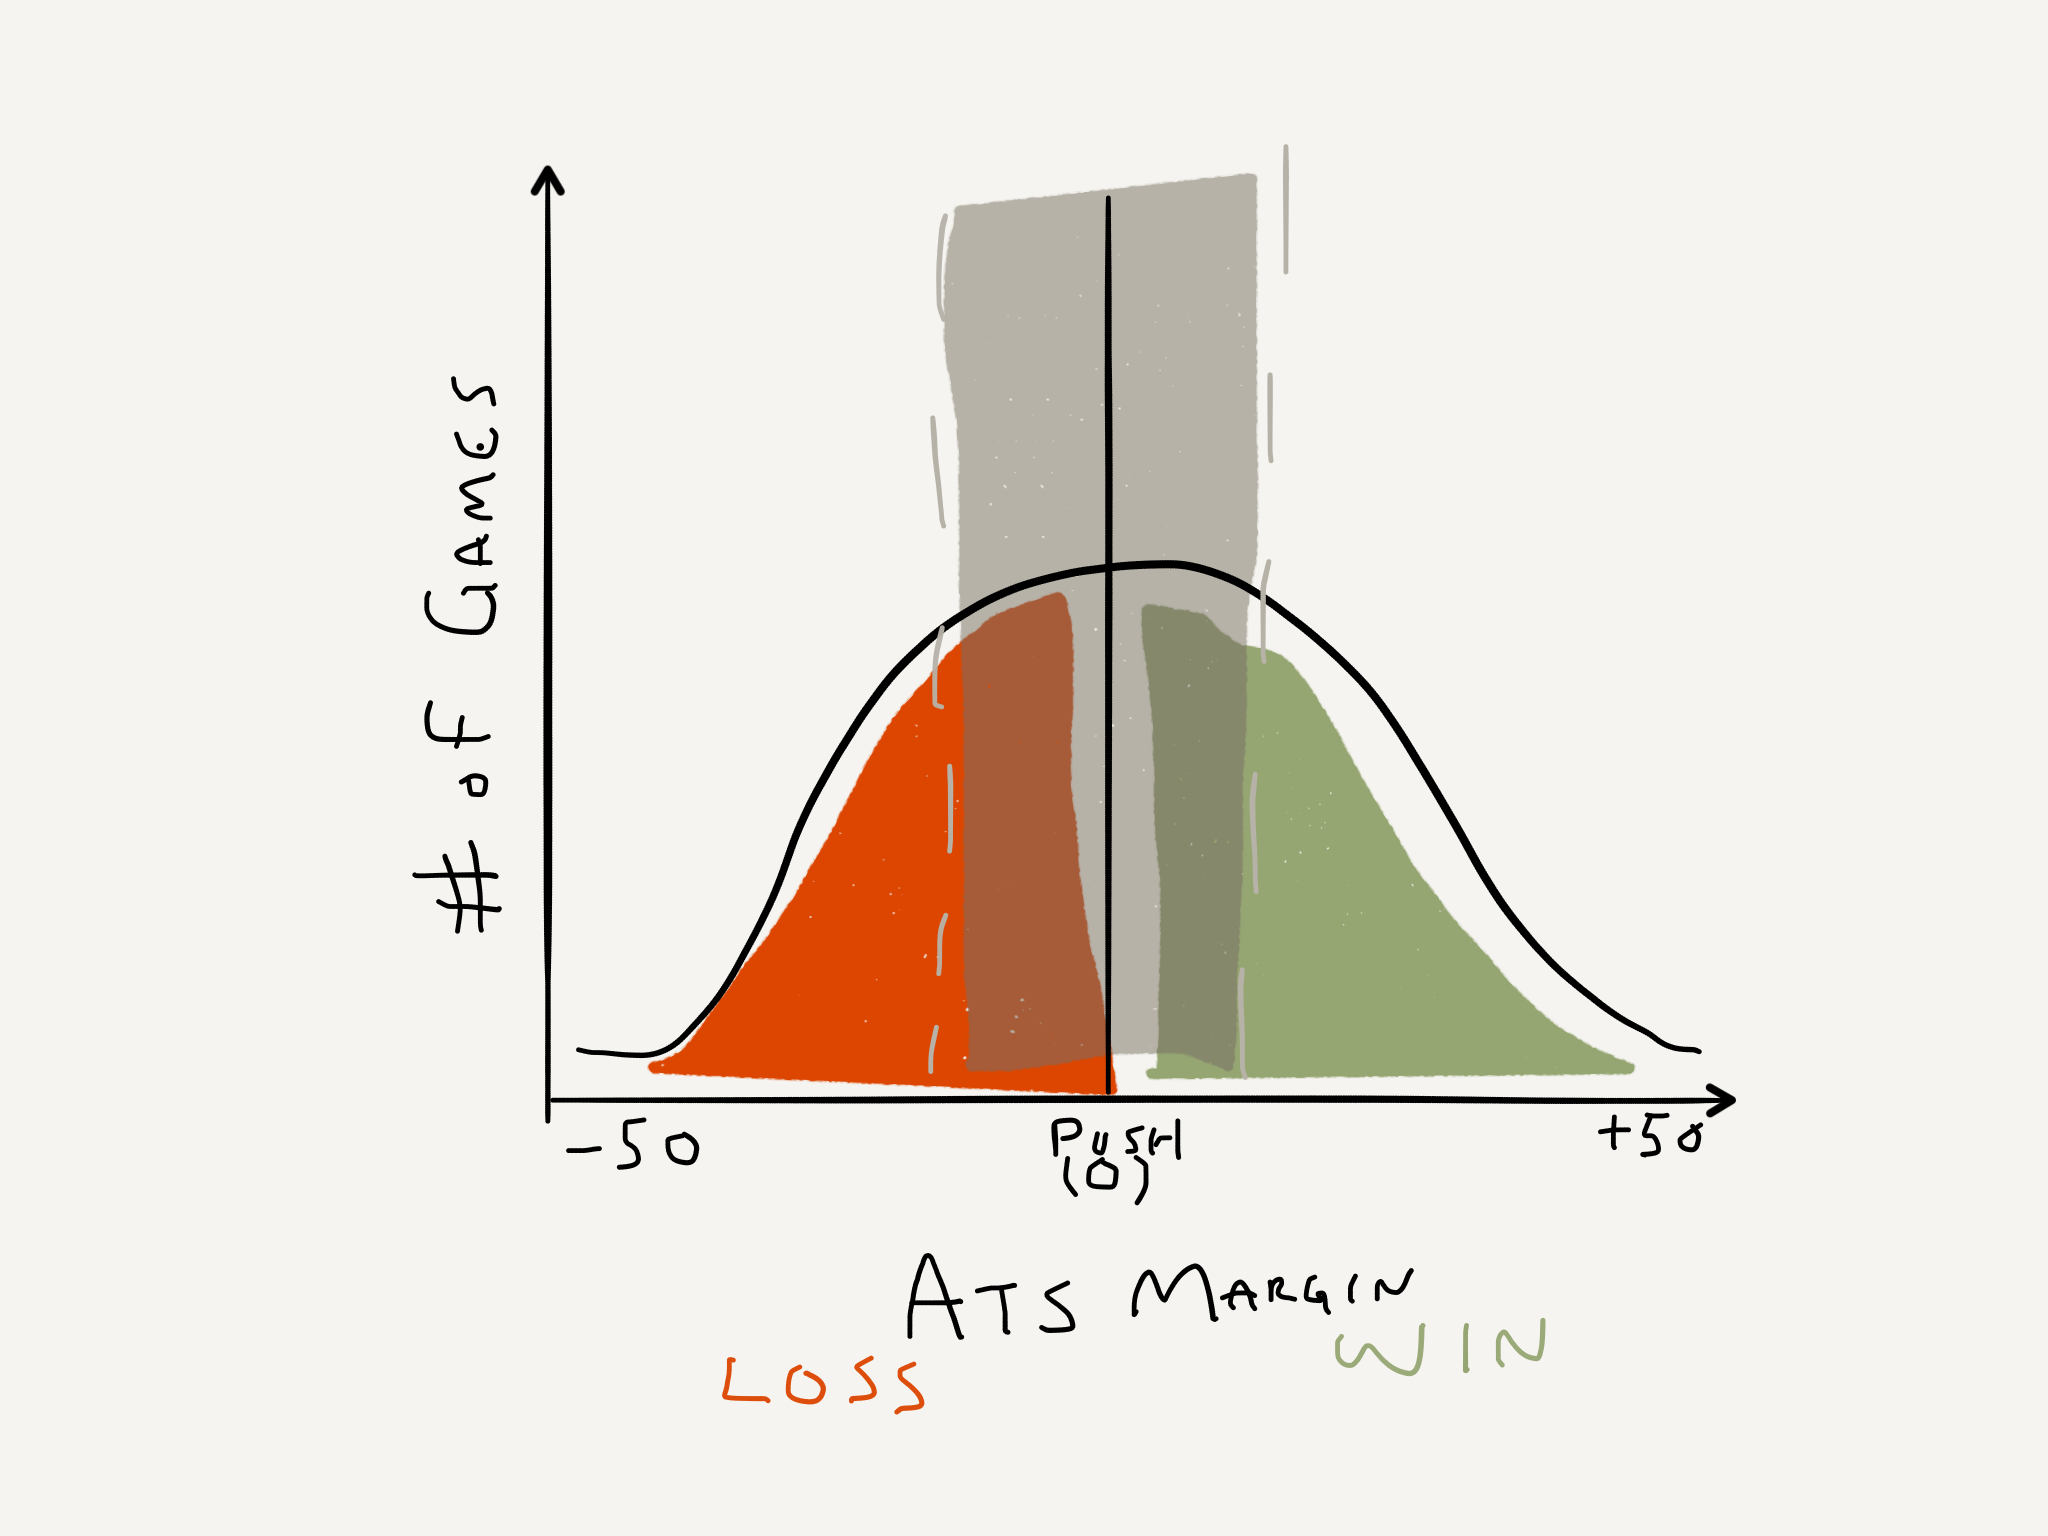
What a random (50% ATS) bettor’s ATS wins and losses look like.
How would the distribution of someone who had an edge picking games look? The distribution curves of ATS wins and losses would need to be altered to have more wins than losses. A profitable bettor would have to eliminate ATS losses, while still picking winners. The orange shaded region (below) is eliminated as a profitable bettor removes ATS losses from the universe of games that they bet. This would eliminate a combination of more ATS loss blowouts (the further left tail) and maybe even some close losses. And drumroll please…what you would be left with is a higher proportion of bad beats to total losses (higher grey-to-red loss ratio).
What a Profitable Bettor’s ATS Game Distribution looks like (Illustrative purposes only and obviously)
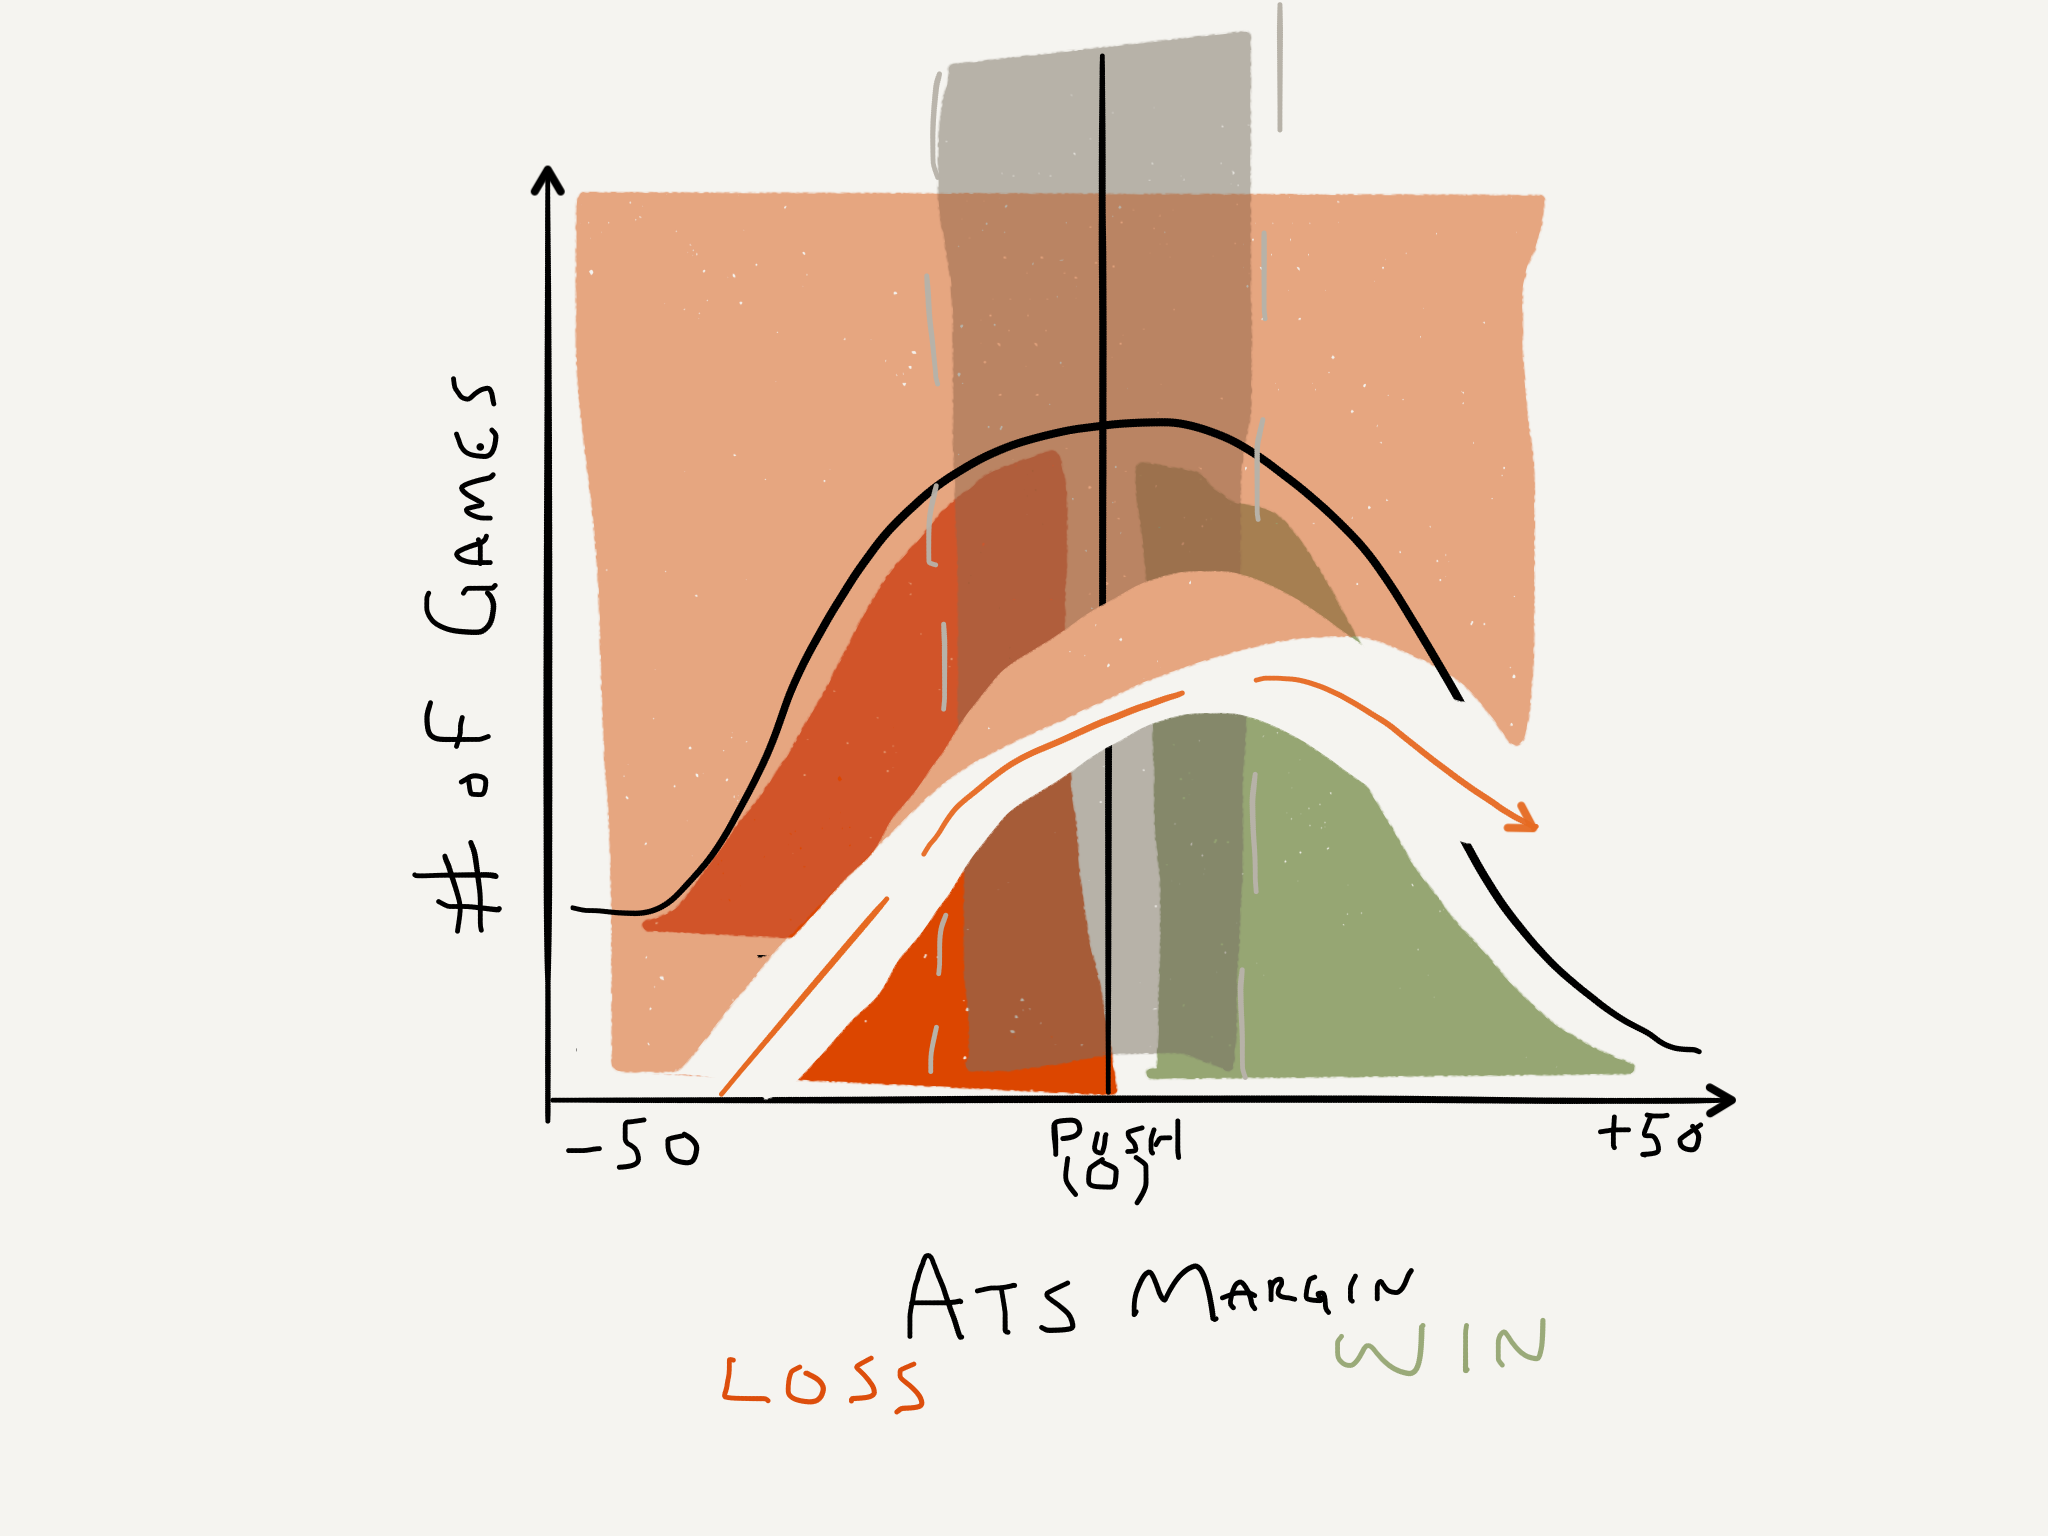
What a winning (53%+) bettor’s ATS profile would look like.